 Skip to content
04 / COMPARE THE SAME SCOPE
LCL vs FCL quote comparison
Put two freight quotes side by side. See the difference and what drives it.
Formula & guide ↓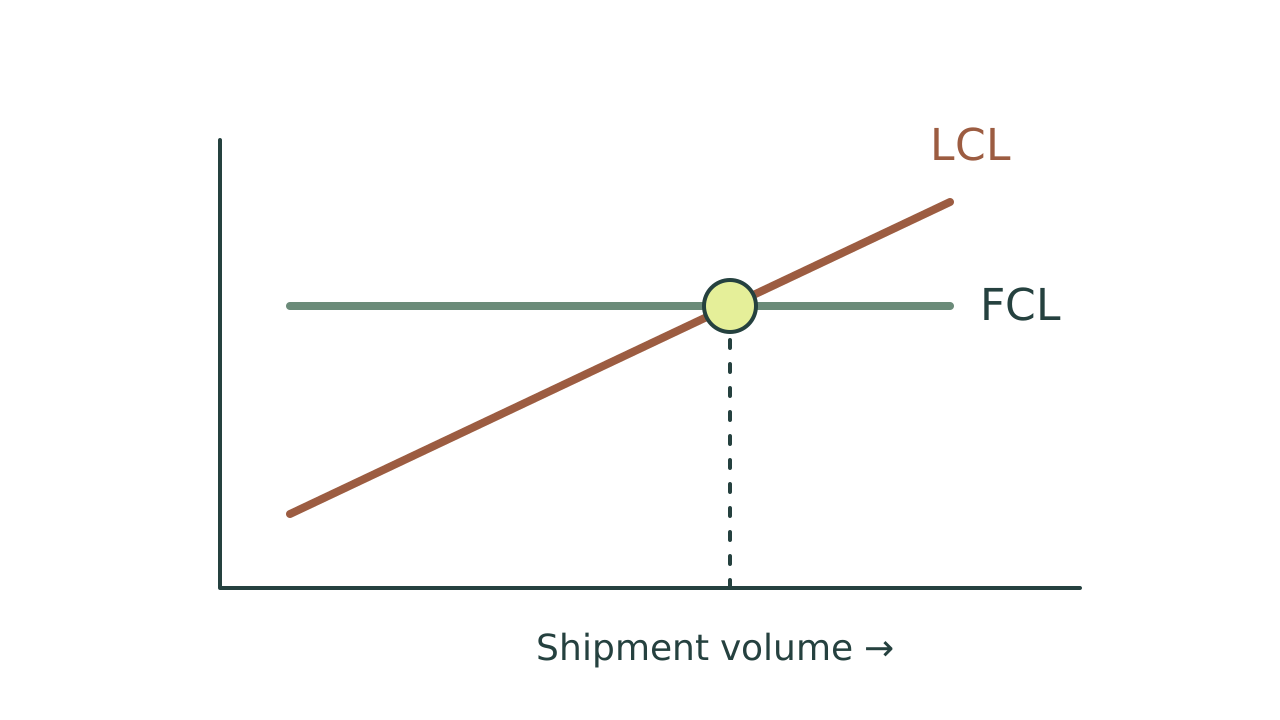
UNDERSTAND THE NUMBER
Clear inputs.
Explainable results.
Compare LCL and FCL using matching service scope and currency. In this model, LCL cost equals the billable revenue tons × the quoted rate + fixed charges. FCL is the all-in total you enter for one container.
How to use this tool
- Use quotes with the same origin, destination, delivery scope, currency and validity.
- Enter the LCL rate, its weight-or-measure rule, minimum and all fixed charges.
- Enter the FCL total and compare. Check physical fit, sailing options and excluded costs before choosing.
A WORKED EXAMPLE
Illustrative USD inputs: 10 m³, 1,500 kg, 1,000 kg per revenue ton, USD 95 per RT, USD 450 fixed LCL charges and USD 2,300 FCL total. LCL is USD 1,400; FCL is USD 900 more. With the same weight and rates, costs meet near 19.47 m³.
What the estimate covers
No live rates are supplied. The graph keeps weight and quote terms fixed while varying volume. It assumes one FCL container can carry the cargo; taxes, storage, insurance and other exclusions must be included in your inputs when applicable.
Is there a universal CBM point where FCL becomes cheaper?
No. It changes with route, date, surcharges, destination handling and the shipment’s weight. Use the two actual quotes you received.
What should go into fixed LCL charges?
Include every quoted charge that does not vary with revenue tons in this simplified model. If another fee uses a different basis, calculate it first and make sure the comparison remains valid.
Why might the tool show no positive break-even volume?
The fixed LCL charges or its weight/minimum floor may already exceed the FCL quote. A zero LCL rate also has no unique volume-based crossing.
THE REFERENCE DESK
Sources & related terms
Source rules and equipment specifications can change. Confirm the relevant service, route and contract before booking.